Grocery prices in 2026: what actually got more expensive
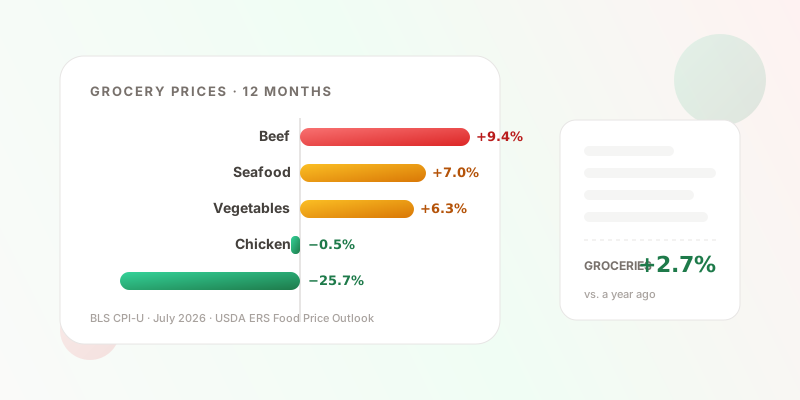
Grocery prices are up 2.7% over the last 12 months. That's the average, and the average is hiding a lot: beef is up 9.4%, eggs are down 25.7%, and coffee costs about half again what it did two summers ago.
This page is a straight category-by-category read of the two official sources — the Bureau of Labor Statistics Consumer Price Index and the USDA Economic Research Service's Food Price Outlook — with every number dated and linked. We refresh it each quarter as new data lands, so the figures below are current as of the July 2026 CPI (released August 12, 2026) and the August 25, 2026 ERS outlook.
+2.7%
grocery prices, last 12 months
July 2026 vs. a year earlier (BLS)
+2.5%
USDA forecast for 2026
interval 1.7 to 3.3%
+2.6%
20-year average, per year
the "normal" pace to compare against
The headline number, and why it doesn't feel like 2.7%
The food-at-home index — the government's term for groceries — rose 2.7% from July 2025 to July 2026. USDA expects the full year to come in around 2.5% (prediction interval 1.7% to 3.3%), which is slightly below the 20-year average of 2.6%.
By the numbers, 2026 is a normal year. It doesn't feel normal for two reasons.
First, prices never came back down. Inflation slowing means prices are rising more slowly, not that they're falling. Grocery prices jumped 11.4% in 2022 and another 5.0% in 2023, and those increases are permanent. Compounding the annual changes from 2020 through 2025, the grocery basket costs roughly 30% more than it did in 2019. A 2.7% increase on top of that is a bigger dollar amount than a 2.7% increase would have been six years ago.
Grocery price inflation by year
Annual average change in the food-at-home CPI. 20-year average: 2.6% per year.
- 20180.4%
- 20190.9%
- 20203.5%
- 20213.5%
- 202211.4%
- 20235.0%
- 20241.2%
- 20252.3%
- 2026*2.5%
* USDA ERS forecast midpoint, August 25, 2026.
Second, the average is an average. The 2.7% figure is weighted by what the typical household buys. If your cart leans toward beef, seafood, and fresh vegetables, your personal number is higher. If it leans toward eggs, chicken, and dairy, your groceries may have actually gotten cheaper this year. More on that below.
Grocery prices by category
Here is the full table, sorted from the biggest increase to the biggest decrease. "Share of grocery spend" tells you how much each category matters to the average bill; a 9% rise in beef moves the total far more than a 25% drop in eggs, because beef is nearly 8% of the basket and eggs are about 1%.
| Category | Share of grocery spend | Last 12 months | 2025 (full year) | 2026 forecast |
|---|---|---|---|---|
| All groceries (food at home) | 100% | +2.7% | +2.3% | +2.5% (1.7 to 3.3) |
| Beef and veal | 7.7% | +9.4% | +11.6% | +9.8% (7.0 to 12.6) |
| Sugar and sweets | 3.9% | +7.4% | +5.1% | +7.1% (6.0 to 8.2) |
| Fish and seafood | 3.8% | +7.0% | +2.0% | +5.9% (4.7 to 7.1) |
| Fresh vegetables | 5.9% | +6.3% | −0.4% | +5.9% (4.0 to 8.0) |
| Fresh fruits | 6.4% | +4.9% | +1.0% | +2.9% (1.4 to 4.4) |
| Nonalcoholic beverages | 12.0% | +4.1% | +3.8% | +4.3% (3.3 to 5.3) |
| Cereals and bakery products | 12.5% | +2.7% | +1.0% | +2.8% (1.9 to 3.7) |
| Processed fruits and vegetables | 3.3% | +2.4% | +1.2% | +3.1% (2.0 to 4.2) |
| Other meats (deli, sausage, etc.) | 2.3% | +2.1% | +1.5% | +1.4% (0.2 to 2.7) |
| Other foods (snacks, condiments, prepared) | 20.5% | +2.1% | +0.9% | +2.3% (1.4 to 3.3) |
| Pork | 4.1% | +0.5% | +1.5% | +0.8% (-1.0 to 2.7) |
| Dairy products | 9.0% | −0.5% | +0.8% | 0.0% (-1.0 to 1.0) |
| Poultry | 4.3% | −0.5% | +1.8% | +0.5% (-0.8 to 2.0) |
| Fats and oils | 2.6% | −1.5% | −0.8% | −2.2% (-3.4 to -0.9) |
| Eggs | 1.3% | −25.7% | +21.9% | −30.8% (-35.3 to -25.3) |
What got more expensive
Beef: +9.4%, and still climbing
Beef is the biggest story in groceries for the second year running. Prices rose 11.6% in 2025 and are up another 9.4% over the last 12 months. USDA forecasts 9.8% for full-year 2026, the highest of any category, and the rise is expected to continue into 2027 at a slower pace.
The cause is supply. Years of drought and high feed costs pushed ranchers to shrink herds, and USDA's January 2026 count put the U.S. cattle inventory at 86.2 million head, the smallest in 75 years. ERS notes federally inspected beef production is down almost 5% as a result. Rebuilding a herd takes years, not months, so there's no quick fix on the horizon. At the shelf, BLS puts a pound of 100% ground beef at $6.89, up from $6.25 a year ago and $5.50 two years ago — a 25% jump in 24 months.
Sugar and sweets: +7.4%
Candy, chocolate, and baked-goods ingredients rose 7.4% over the year, with USDA forecasting 7.1% for 2026. ERS says the increase is primarily in candy and chewing gum, which fits with cocoa prices that hit records in 2024 and are still working through manufacturers' costs. Sugar and sweets are only about 4% of the grocery basket, so this stings more in the Halloween aisle than in the monthly total.
Fish and seafood: +7.0%
Seafood is up 7.0% year over year after rising only 2.0% in 2025. It's a smaller category (under 4% of grocery spending) but one where the swing is noticeable per trip, because a single seafood purchase is often the most expensive item in the cart.
Fresh vegetables (+6.3%) and fresh fruits (+4.9%)
Produce is the category that reversed hardest. Fresh vegetable prices were essentially flat in 2025 (−0.4%) and are now up 6.3%, with USDA forecasting 5.9% for the year. Fresh fruit is up 4.9%. ERS singles out tomatoes (+12.8%), lettuce (+7.5%), and potatoes (+3.4%) as the vegetables driving the increase. Produce prices are volatile month to month — fresh vegetables actually fell 1.6% in July alone — so expect the annual figure to move around as the year progresses.
Nonalcoholic beverages: +4.1%, driven by coffee
The beverage category is up 4.1%, and coffee is doing most of the work. The coffee CPI rose 10.3% over the last 12 months on top of a 14.5% rise the year before. BLS's average price for a pound of ground roast coffee is $9.32, up from $8.41 a year ago and $6.31 two years ago — a 48% increase since July 2024. Weather-damaged harvests in Brazil and Vietnam, the two largest producers, pushed green-coffee prices to records in 2025. Roasters buy months ahead, so the shelf price is still catching up even though global supply is recovering in 2026 and the retail price has eased from its April peak of $9.72.
Everything in the middle: +2% to +3%
Cereals and bakery (+2.7%), processed fruits and vegetables (+2.4%), deli and other meats (+2.1%), and the big "other foods" bucket of snacks, condiments, soups, and prepared meals (+2.1%) all rose at roughly the overall rate. Together these are close to 40% of the grocery basket, and they're the reason the average lands where it does.
What got cheaper
Eggs: −25.7%
The 2025 egg spike has fully unwound. Avian flu outbreaks pushed egg prices up 21.9% in 2025, with retail prices peaking above $6 a dozen in early 2025 in many markets. Flocks have since recovered, and the average price of a dozen grade A large eggs is now $2.19, down from $3.60 a year earlier. USDA forecasts eggs to finish 2026 down 30.8% for the year. If your grocery bill dropped this year without you changing anything, this is probably why.
Fats and oils: −1.5%
Cooking oil, butter, and margarine fell 1.5% over the year, and USDA expects the category to finish 2026 down about 2.2%.
Poultry (−0.5%), dairy (−0.5%), pork (+0.5%)
The three other major proteins are flat to slightly down. Boneless chicken breast averages $4.15 a pound, a bit less than a year ago. Dairy as a category dipped 0.5%, though whole milk itself is up 3.6% to $4.31 a gallon; a 4.2% drop in cheese prices offsets it. Pork is up just 0.5%.
The gap between beef and chicken is the widest it has been in years: a pound of ground beef now costs 1.66 times a pound of boneless chicken breast, up from 1.39 times two years ago and the highest ratio in BLS price data going back to at least 2018. A household that moves two beef dinners a week to chicken or pork will see it in the total.
Actual shelf prices: staples over three years
Index percentages are useful for comparisons, but people shop in dollars. BLS also publishes national average prices for specific items. Here are eight staples in the same month across three years.
| Item | Jul 2024 | Jul 2025 | Jul 2026 | 1-year change | 2-year change |
|---|---|---|---|---|---|
| Ground beef, 100% beef per lb | $5.50 | $6.25 | $6.89 | +10% | +25% |
| Coffee, ground roast per lb | $6.31 | $8.41 | $9.32 | +11% | +48% |
| Milk, whole per gallon | $3.98 | $4.16 | $4.31 | +4% | +8% |
| Chicken breast, boneless per lb | $3.95 | $4.20 | $4.15 | −1% | +5% |
| Bananas per lb | $0.61 | $0.66 | $0.65 | −2% | +7% |
| Bread, white per lb | $1.98 | $1.85 | $1.82 | −2% | −8% |
| Flour, white per lb | $0.57 | $0.56 | $0.54 | −4% | −5% |
| Eggs, grade A large per dozen | $3.08 | $3.60 | $2.19 | −39% | −29% |
A few things stand out. Bread and flour are cheaper than two years ago as wheat prices eased. Bananas, the most-purchased fruit in America, have barely moved. And the two items that went in opposite directions — ground beef and eggs — are the two people notice most.
Why your grocery inflation isn't the national number
The CPI weights every category by how much the average household spends on it. Your household isn't average.
Same year, two very different grocery bills
+9.4%
Beef, seafood, and fresh produce
A household that cooks beef-heavy dinners, or fills the cart with organic produce, saw its basket rise well above the 2.7% average.
−25.7%
Eggs, poultry, dairy, and oils
A household built on eggs, chicken, and milk may have paid less this year than last.
Meat, poultry, and seafood together make up about 22% of the typical grocery basket, and beef alone is nearly 8%. Eggs are 1.3%. So a beef-heavy household could easily have seen its grocery bill rise at double the national rate, while a household that eats a lot of eggs, chicken, and dairy may have come out flat or slightly ahead.
The other household most likely to feel a bigger hike in 2026 is the one that's heavy on produce and leans on organic. Fresh vegetables (+6.3%) and fresh fruit (+4.9%) are both rising well above the 2.7% grocery average, and the items ERS singles out — tomatoes, lettuce, potatoes — are exactly what fills a produce-first cart. Organic makes it worse in dollar terms: organic produce already carries a premium over conventional, so the same percentage increase lands on a higher base. A household that buys most of its groceries in the produce section, and buys them organic, is likely running well ahead of the national number this year.
The only way to know your own number is to look at your own receipts over time. That's what a personal price history does: it tracks the items you actually buy at the stores you actually shop, which is a different question from the one CPI answers. If you scan your receipts with GroceryTrack, the price history shows you which of your regular items went up, which store raised them, and by how much.
Reading this on your computer?
Email yourself the GroceryTrack app install link so it's waiting on your phone — no searching the App Store later.
One-time email. No newsletter, no spam.
What USDA expects next
The August 2026 Food Price Outlook trimmed the 2026 grocery forecast to 2.5%, down from 2.7% in the July outlook (the all-food forecast moved from 3.1% to 3.0%). For 2027, ERS's early estimate is 2.1% for groceries — but the prediction interval at this range is wide (−5.7% to 10.5%), which is ERS's way of saying it's too early to know.
Category by category, the direction for the rest of 2026 is:
- Still rising fastest: beef (+9.8%), sugar and sweets (+7.1%), fresh vegetables (+5.9%), fish and seafood (+5.9%)
- Rising at a normal pace: nonalcoholic beverages (+4.3%), processed produce (+3.1%), fresh fruit (+2.9%), cereals and bakery (+2.8%), other foods (+2.3%)
- Flat: pork (+0.8%), poultry (+0.5%), dairy (0.0%)
- Falling: fats and oils (−2.2%), eggs (−30.8%)
Watch for the next ERS update on September 25, 2026, which will fold in the August CPI. We'll update this page after the following quarter's data.
How to read and cite this page
Sources. All index changes are from the BLS Consumer Price Index for All Urban Consumers (CPI-U), U.S. city average, as republished with forecasts in the USDA ERS Food Price Outlook (updated August 25, 2026). Shelf prices are from BLS Average Price Data, U.S. city average. Annual history is from the ERS "Annual percent changes in selected Consumer Price Indexes" series.
Definitions. "Groceries" means the CPI food-at-home index, which covers food and nonalcoholic beverages bought for consumption at home and excludes restaurant meals, alcohol, and household supplies. "Last 12 months" is the not-seasonally-adjusted change between the same month in consecutive years. Full-year figures are annual averages, not December-to-December. Forecast intervals are ERS 95% prediction intervals (ERS: the annual figure should land inside the interval "19 out of 20 times").
Refresh schedule. We update this page quarterly after the ERS release that follows each quarter's final CPI. The tables always name the CPI month they reflect. If you're citing a number, cite the month with it.
Cite as: GroceryTrack, "Grocery prices in 2026: what actually got more expensive," grocerytrack.food/blog/grocery-prices-2026. Data through July 2026 CPI.
Update log
- September 1, 2026 — First published. Data through the July 2026 CPI and the August 25, 2026 ERS Food Price Outlook.
If you want to know whether your groceries got more expensive this year — not the national basket — the place to start is your own receipts. Our guide to tracking your grocery spending walks through the options, and Grocery Spending by Category shows what a normal breakdown looks like so you can see where beef or eggs land in your own budget.

Get started
Every new GroceryTrack account comes with a 30-day free trial of all Pro features—unlimited scans, full history, and advanced analytics. No credit card needed.
After the trial, basic features remain free. If you want the full experience, the Pro plan is available at $3.99/month for early adopters.
Start scanning
Sources: USDA Economic Research Service, Food Price Outlook (August 25, 2026); USDA ERS Food Price Outlook Summary Findings; Bureau of Labor Statistics, Consumer Price Index — July 2026; Bureau of Labor Statistics, Average Price Data.